Set the google analytics measurement ID
Login to your Google Analytics account.
If you already have a Property you can copy its tracking code (measurement ID) by doing the following:
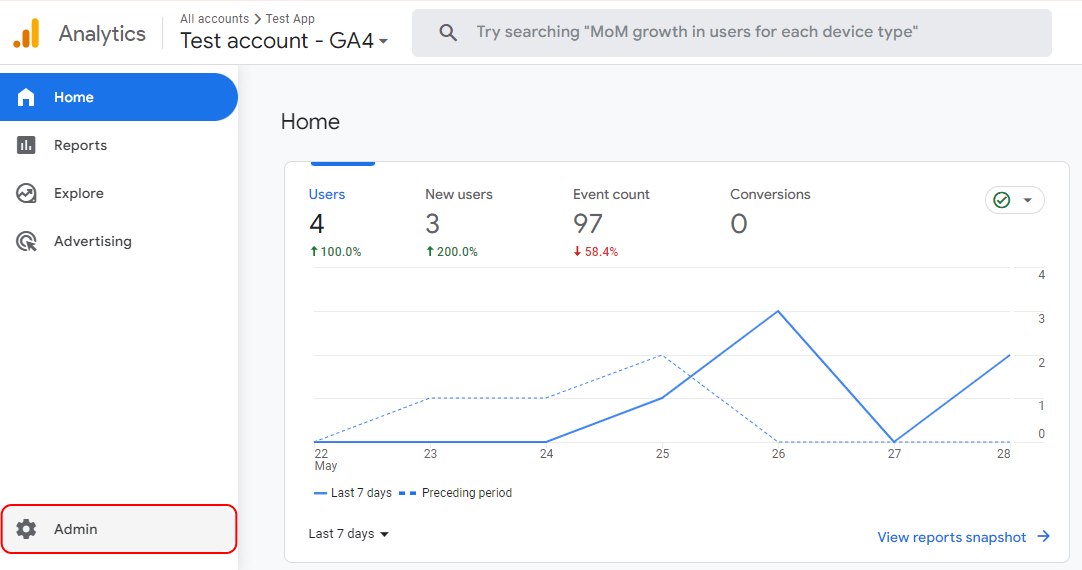
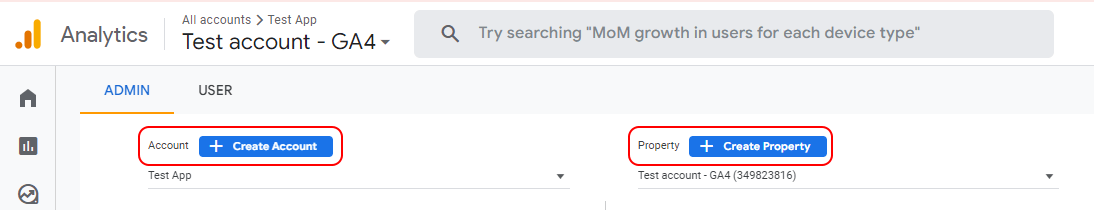
Click on the Admin button.
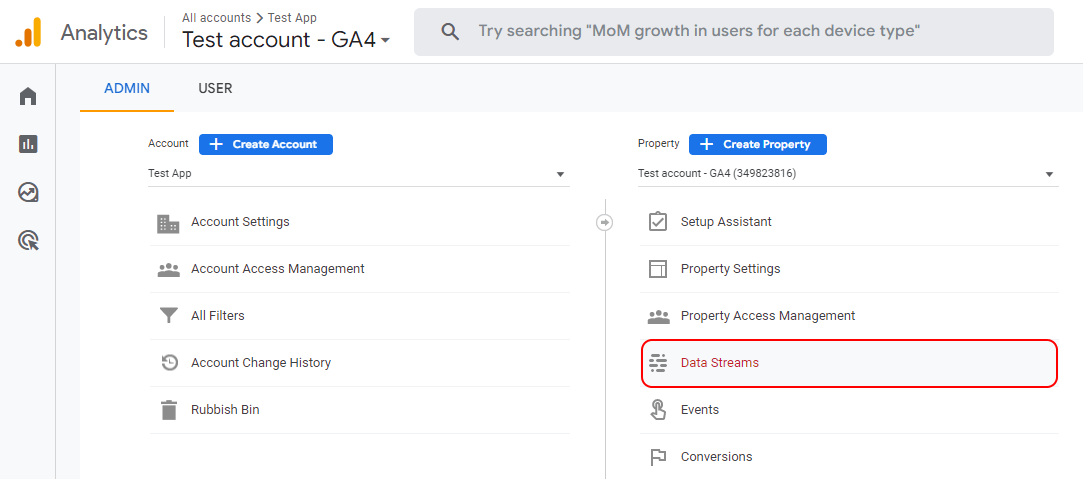
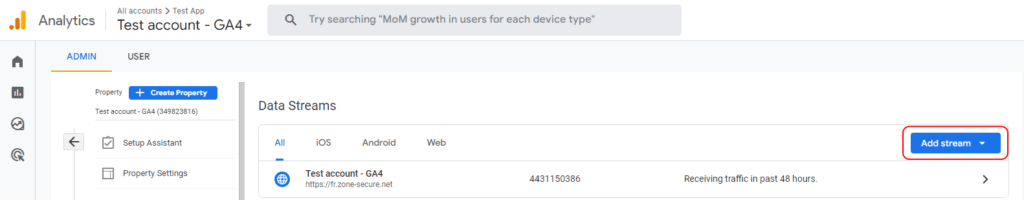
Select the appropriate tracking property and choose Data Streams.
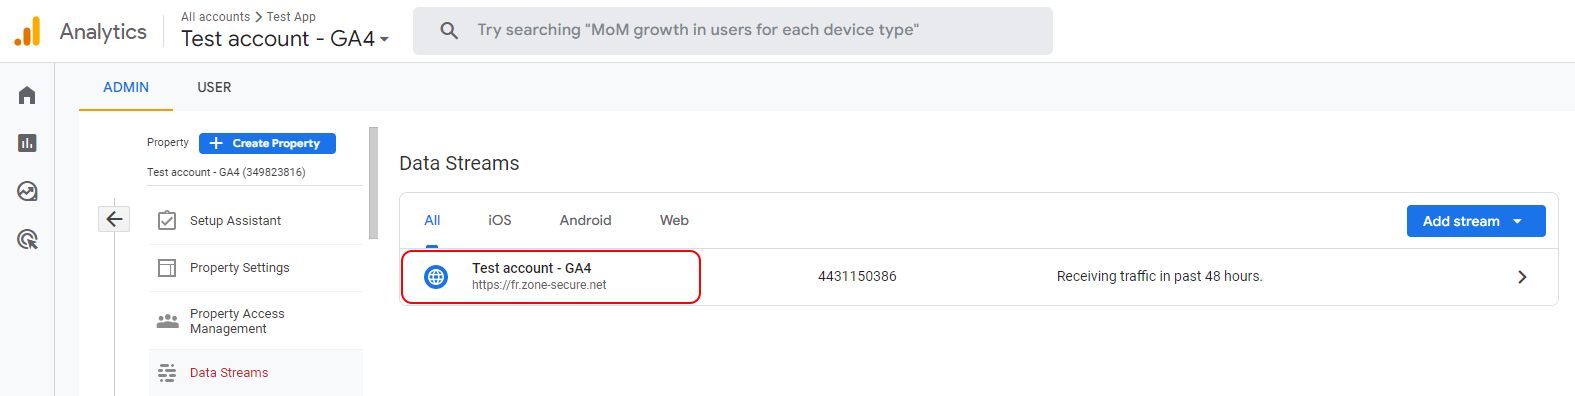
Click on the data stream you wish to use.
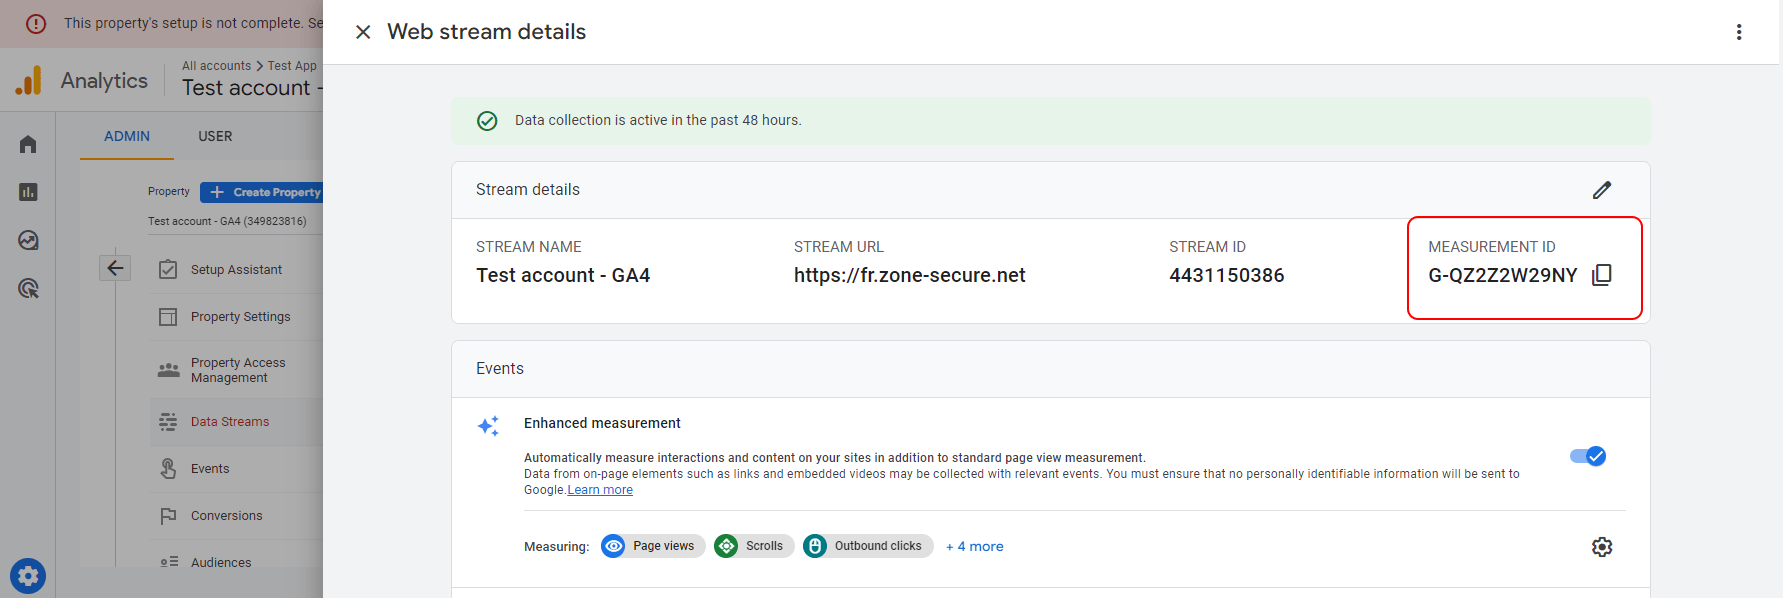
Copy its measurement ID.
Alternatively you can create a new Account, Property or Data stream
To create a new Data stream for your publication click the "Add stream" button.
Select “Web” for the stream type.
For the URL use the domain of the publication.
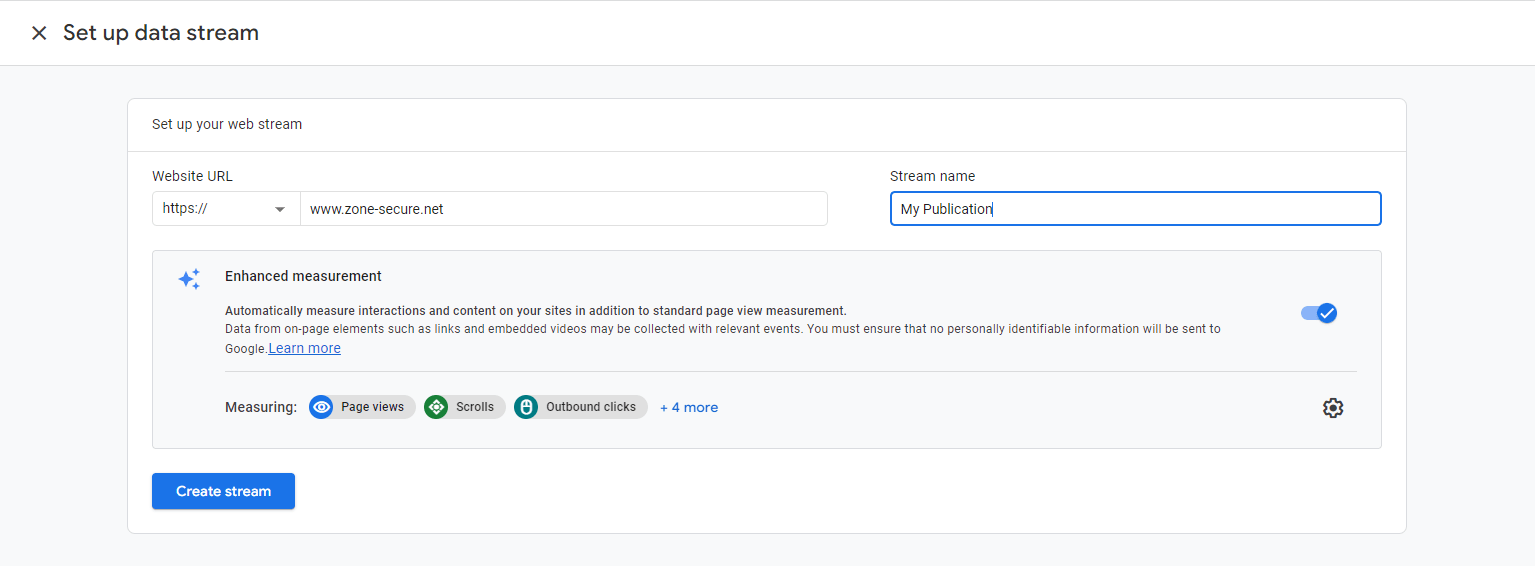
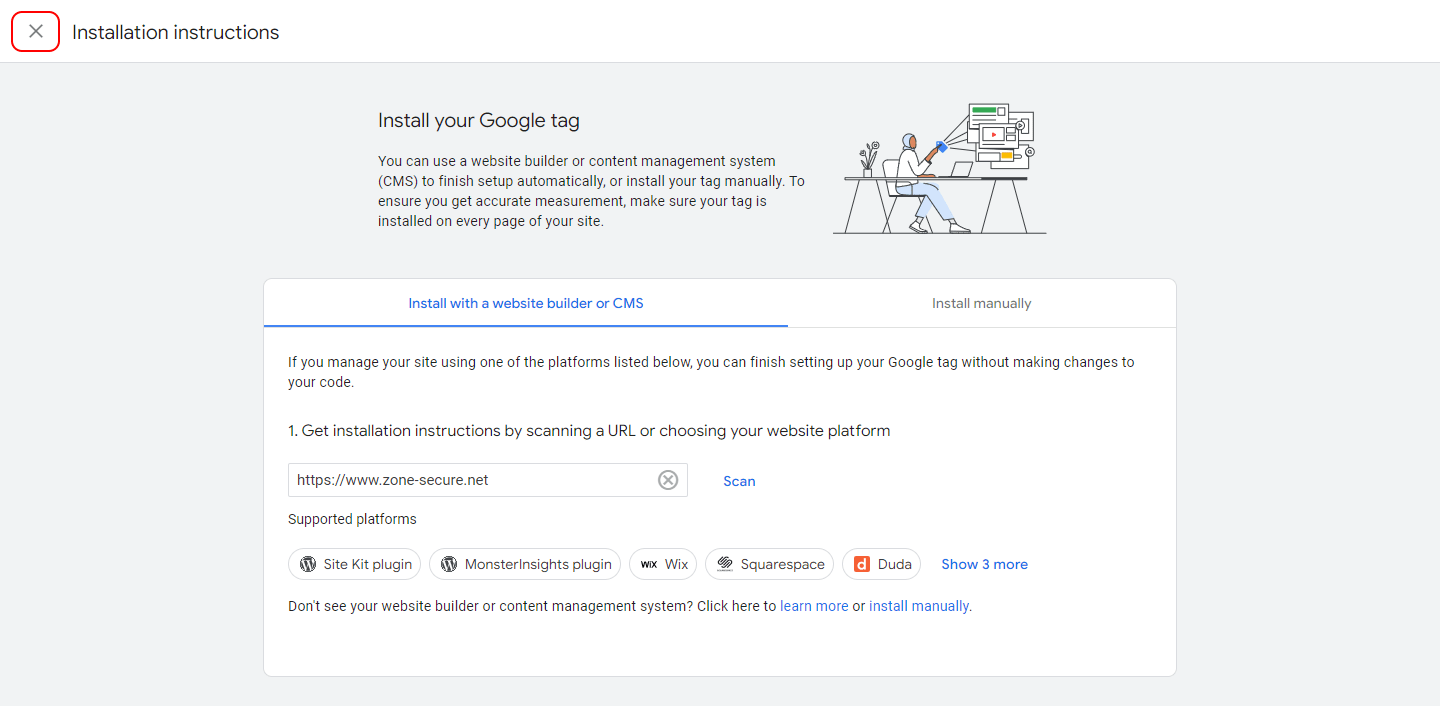
You can ignore the Installation instructions because you only need the measurement ID.
Copy the Measurement ID in the top right corner.
Login to the Webpublication Administration area
Edit the Publication you wish to track. In the General Settings tab under SEO & Analytics create a google analytics tracker
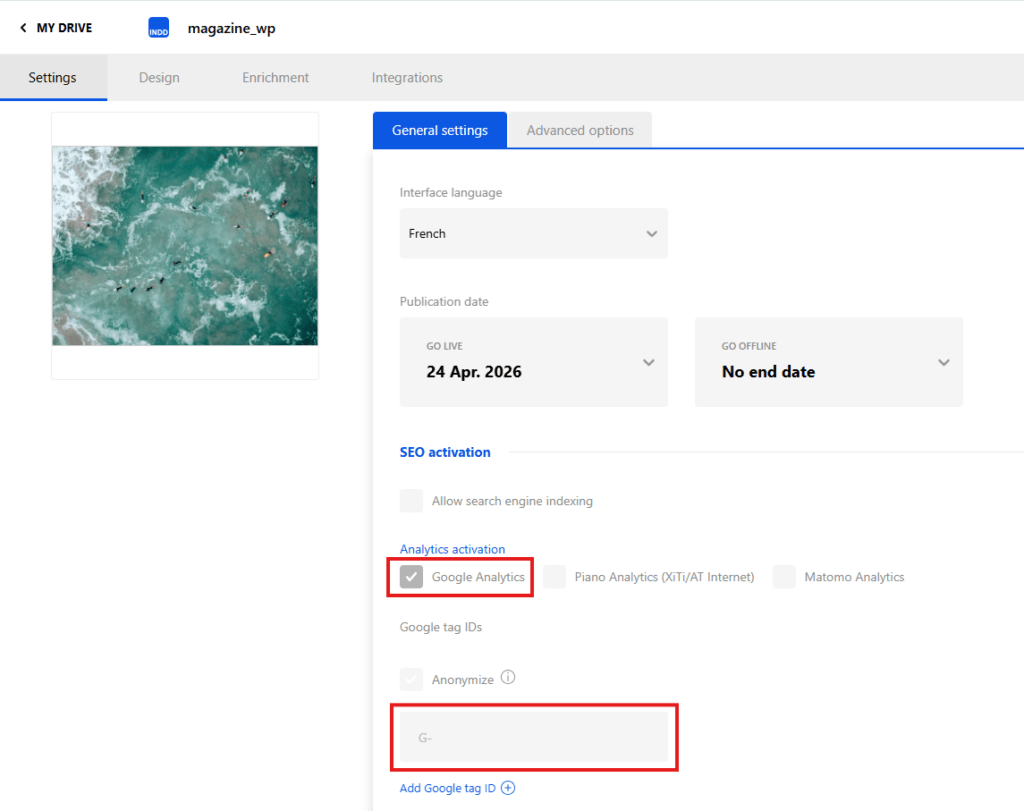
Paste the measurement ID in the google analytics configuration field.
Configure advanced events
By completing the configuration above you will have a basic analytics integration and will be able to see page view statistics.
If you want to be able to save advanced events (like the number of times a page has been shared, zoomed etc.), you need to create 3 custom dimensions.
For optimal results, advanced events should be configured before launching your project to ensure all statistics are accurately tracked from the start. However, you can set them up later if needed; they will begin collecting data from the moment they are created.
To create these custom dimensions, you need to:
Go to the property settings and click on “Custom definitions” then "Create custom dimensions".
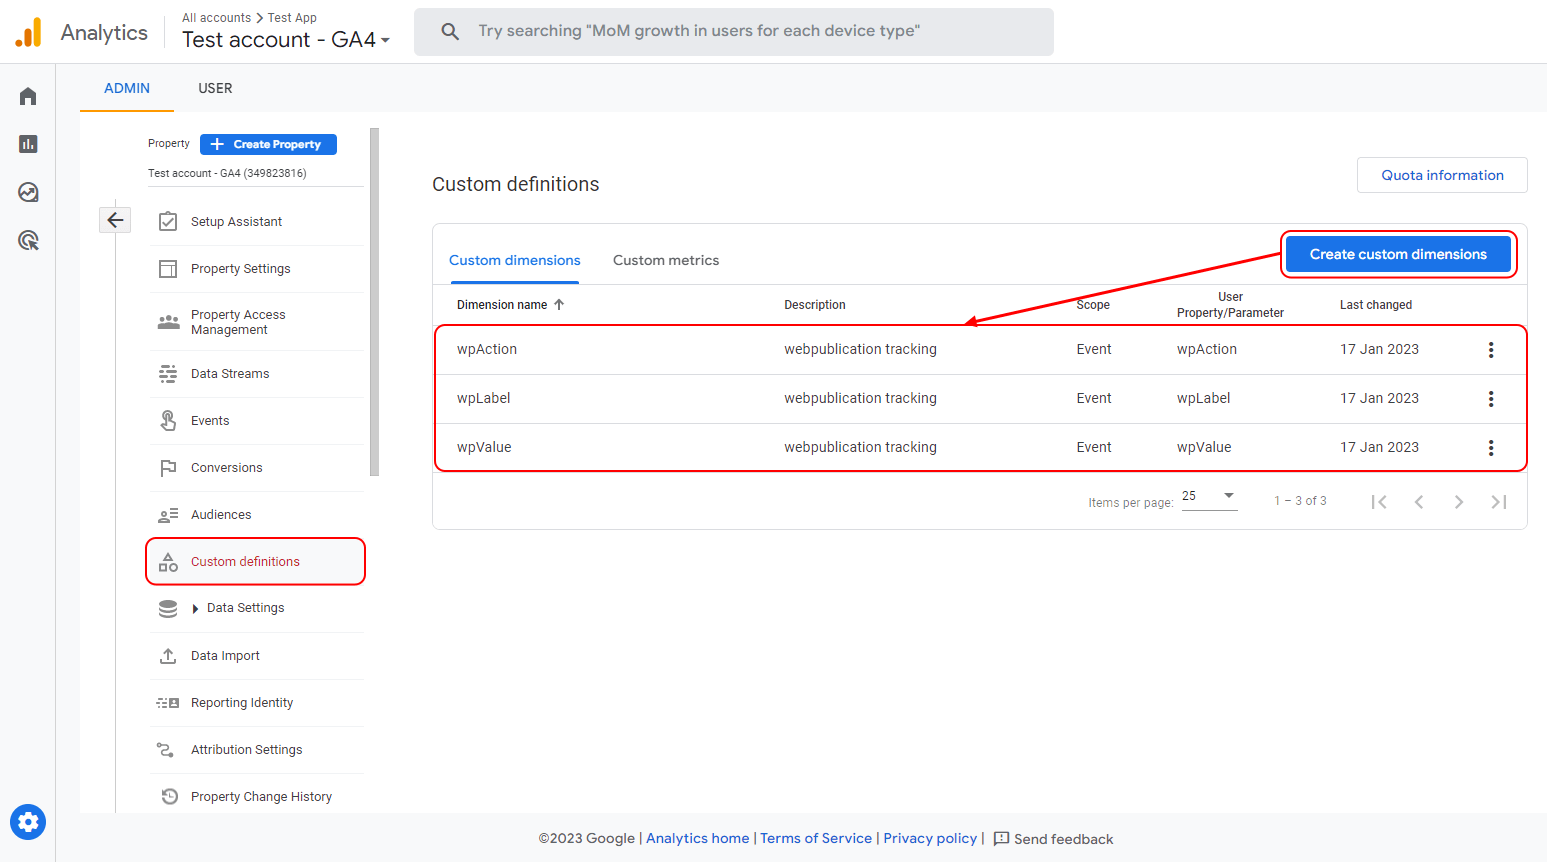
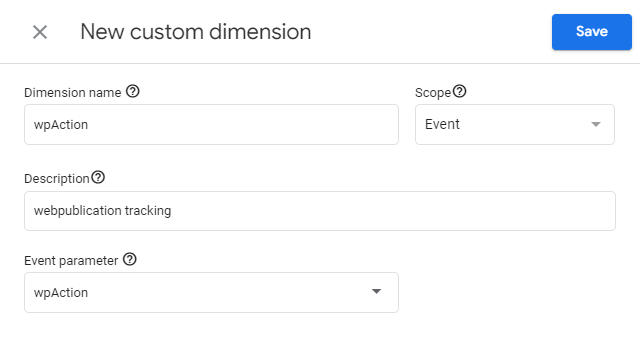
Create these 3 dimensions wpAction, wpLabel, wpValue. Make sure the labels are exactly the same as indicated (the Capital letters are important and there must be no typos). The dimension name and event parameter must be the same.
Create a report with advanced events
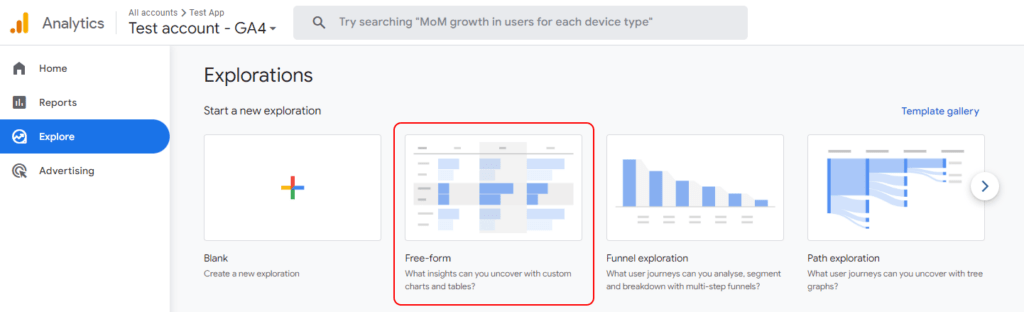
Click “Explore” then "Free-form".
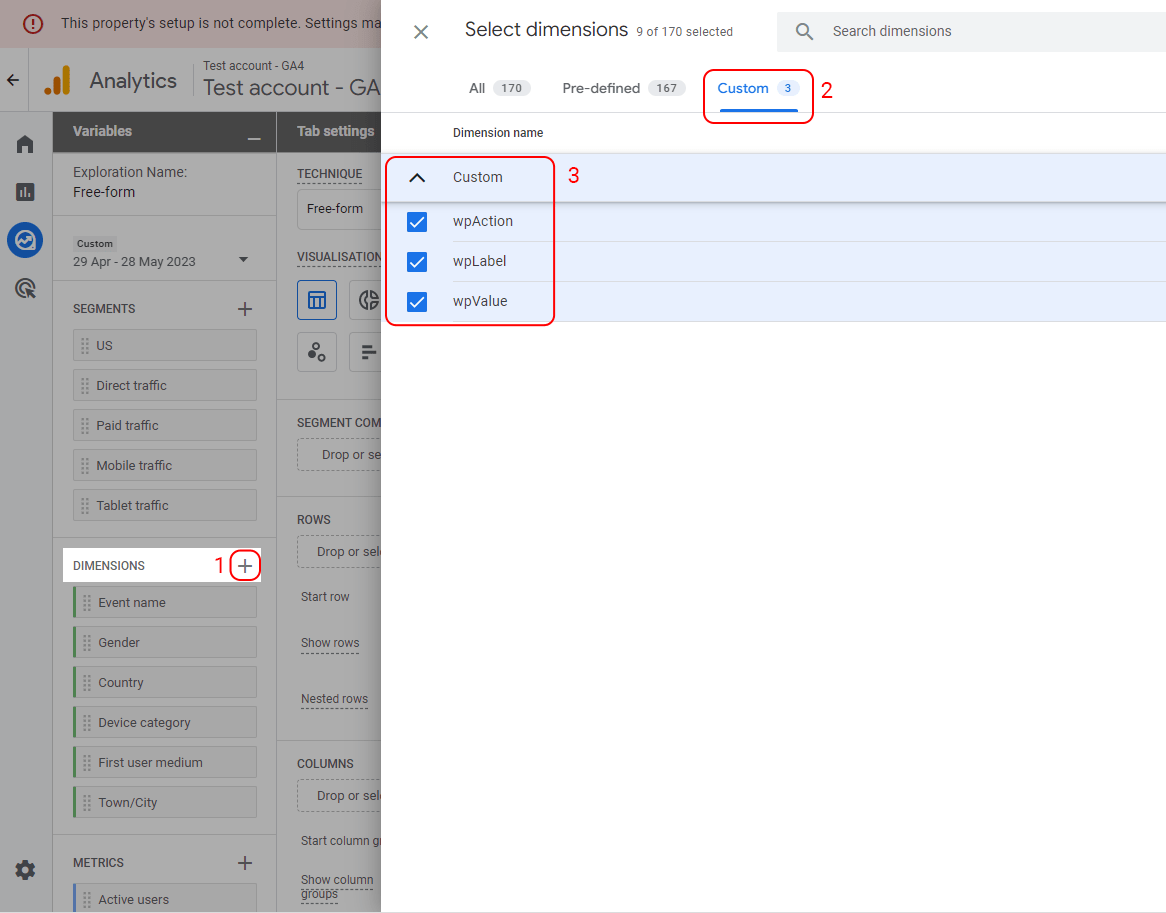
Add dimensions to the report: Click on the “+” near DIMENSIONS, search for “wp” or click on the Custom dimensions tab. Select all 3 custom dimensions we created earlier and click the Import button (in top right corner).
Drag and drop the 3 custom dimensions and the Event count metrics like in the screenshot below
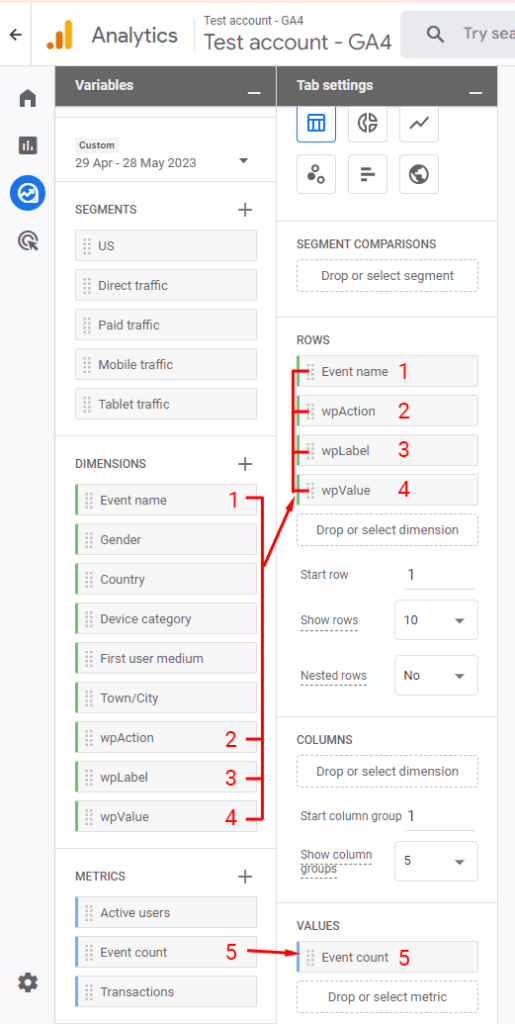
You now have a report showing all the advanced events. The example screenshot is taken after the publication has had some user interactions. Please note that events can take 24 hours to appear here.
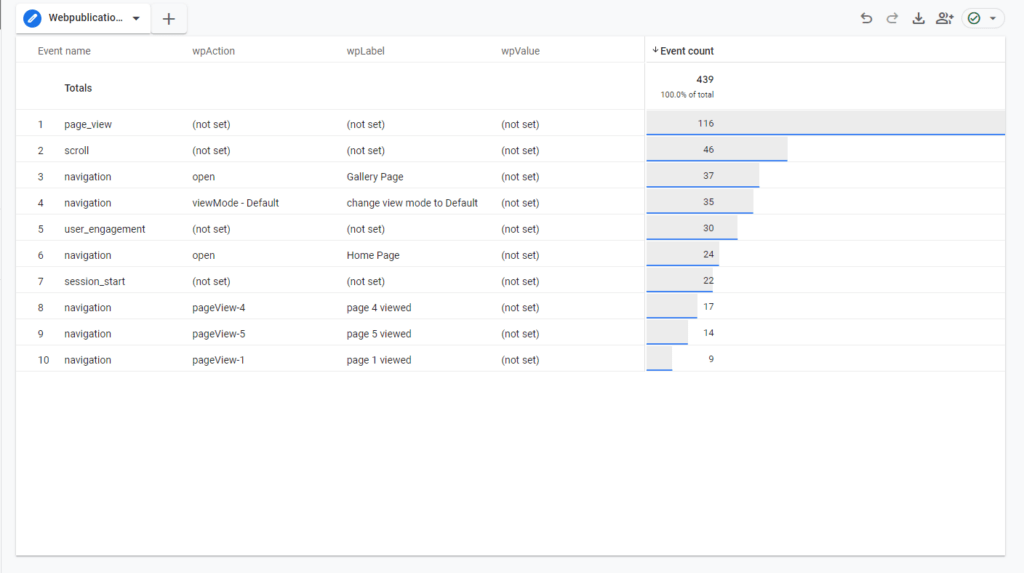
If you wish you can create other reports with filters to show only some types of events.


No comments.